Cycling Stats Worth Watching (On a Desk, Not in Another Tab)
Published
July 7, 2026
Topic
cycling stats
Strava tracks dozens of cycling stats for every ride: distance, elevation, speed, power, heart rate, suffer score, gear, weather, and segment PRs. Most of that belongs in post-ride review, not on a panel beside your keyboard. Desk displays work when a number changes your behavior this week, not when it satisfies curiosity once.
The trick is picking stats that reward glances. Open the app for depth. Keep a short list in view for momentum.
Hook: the stats you forget by Thursday
You set a yearly kilometer target in January. You nailed two solid weeks in spring. By mid-summer, client travel and heat waves compress riding into weekends only. The target still exists in Strava. You just do not see it until guilt pushes you to open the app.
The same pattern hits weekly consistency. You plan four rides. You complete two before Friday meetings stack up. Without a visible week grid, the gap stays abstract until Sunday.
These are cycling stats worth watching because they connect daily choices to season-long outcomes. They are not exotic. They are easy to ignore when they live behind a lock screen.
Gap: tabs and notifications bury the basics
Phone dashboards excel at everything at once. Feed, kudos, club challenges, segment hunting. The cycling stats you care about for planning sit three taps deep or mixed with social noise.
Checking Strava becomes a bundle deal: you wanted yearly progress and you got someone else's race photos. Multitasking training with social browsing is how athletes lose ten minutes and still forget whether Tuesday's commute counted.
A desk tab in a browser is slightly better until you minimize the window, switch profiles, or leave the monitor off all weekend. Tabs are invisible when they are not focused. Training awareness needs persistence, not another bookmark.
Bridge: choose stats that survive a glance
A useful desk stat passes three tests:
- It updates often enough to matter. Weekly and daily views beat lifetime totals for most riders.
- It reads in monochrome. E-ink panels skip color-coded elevation and rich map tiles. Simple bars, totals, and route outlines work.
- It nudges behavior without nagging. Goals and empty days on a week grid inform. They do not buzz like a notification.
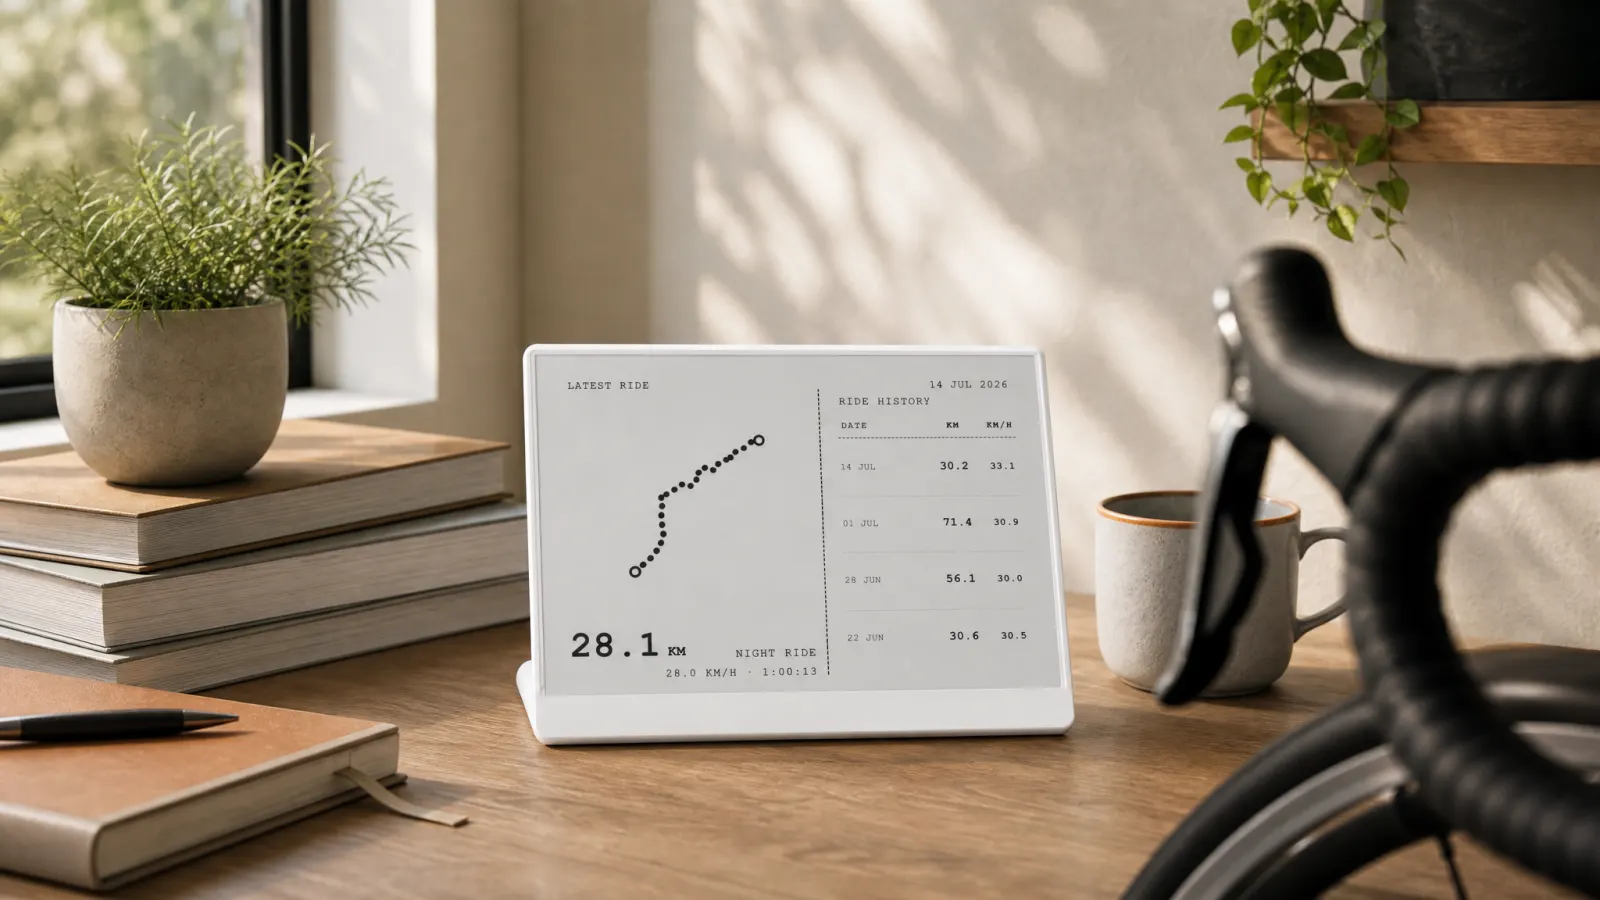
Activity Frame on TRMNL follows that filter. It pulls a small set of views from Strava and formats them for e-ink. No custom spreadsheet, no API project unless you want one for other reasons.
Product: four screens mapped to real cycling stats
Latest rides: recent distance and route shape
Recent activity list answers "what did I actually do?" Distance, time, and a simplified route trace cover most desk needs. You spot short weeks, confirm yesterday's commute synced, and see loop vs out-and-back patterns without opening the map tab.
Route shapes on e-ink are not poster art. They are spatial reminders that training happened in real places, useful when volume is fine but motivation feels flat.
Yearly goals: annual distance progress
If you set a Strava yearly target, this screen keeps the bar in view. Cyclists tracking total kilometers for health, bike commuting, or base miles get the most from it. The number moves when rides sync, not when you remember to check.
Pair this with Strava dashboards vs an always-on desk screen if you are deciding between app views and hardware.
Week grid: consistency over hero weeks
One big weekend ride can hide four empty weekdays. A week grid makes gaps visible by Wednesday, when you can still fit a short spin. Consistency-minded commuters and gran fondo prep riders both benefit.
This stat rarely shines in social feeds. It shines on a desk where you plan the next two days.
Friends: light social proof
Friend activity is not a performance metric. It still moves behavior for some riders. Seeing that a training partner rode this morning can be the push to kit up after work. Activity Frame keeps a trimmed friends view, not a scrollable feed.
Skip this screen if social comparison stresses you out. The other three carry most utility.
Stats that stay in Strava on the phone
Keep deep dives on the device built for them:
- Power and heart rate analytics need charts and zoom. E-ink is the wrong surface.
- Segment leaderboards invite compulsive checking better suited to intentional sessions.
- Equipment and bike component logs change rarely. No desk panel required.
- Heatmaps and explore maps answer different questions than daily awareness. Activity Frame does not replicate Strava heatmaps. For what those maps show vs a desk panel, see what Strava heatmaps show.
Building a desk lineup by rider type
Commuter with a yearly health target: yearly goals plus week grid.
Weekend warrior with varied routes: latest rides plus yearly goals.
Club rider motivated by peers: week grid plus friends.
Base-mileage builder: yearly goals alone may be enough until volume habits slip.
Start narrow. Add a screen after two weeks if you still open Strava for something the panel could show.
Setup path
Activity Frame connects Strava to TRMNL in four steps: create an account, connect Strava, install the plugin on your device, pick screens. Refresh follows your TRMNL schedule when activities sync.
Full instructions: how to show Strava on an e-ink desk display with Activity Frame.
Soft CTA
You already track the rides. Put the stats that change your week where you will see them without opening Strava on your phone.
Create an Activity Frame account, connect Strava, and choose the cycling stats that belong on your desk.