Strava Heat Map vs Ride History: Two Jobs, One Habit Gap
Published
July 18, 2026
Topic
strava heat map
A strava heat map answers where. Ride history answers when, how far, and how often. Both live inside Strava, yet they solve different problems. Confusing the two is why a rider can spend twenty minutes studying bright corridors on a map and still forget whether this week hit three sessions.
If you train regularly, you probably use both views. The gap is not knowledge. It is visibility.
What a heat map is built to do
A heat map aggregates GPS tracks into density. Personal maps show your repeated loops. Global maps show collective popularity. The visual language is geographic memory.
Strengths:
- Spot rut routes you repeat without noticing
- Plan exploration in dark zones nearby
- Compare seasonal patterns when filters allow
Limits:
- Weak signal for this week's kilometer total
- No clear yes or no on annual goal pace
- Easy to treat as productive when it is only browsing
Heat maps excel before you roll out the door on a free Saturday. They are poor monitors for a Tuesday deadline day.
For a deeper read on personal maps, see What a Strava Heatmap Shows.
What ride history is built to do
Ride history is a chronological list. Each entry carries distance, time, elevation, and notes. Filters and totals summarize periods if you dig.
Strengths:
- Confirm last ride distance and date
- Review intervals or commutes in sequence
- Export or share a specific activity
Limits:
- Lives behind the Strava app or web login
- Feels like archive, not ambient context
- Competes with every other notification on your phone
Checking history is reactive. You open it after a ride or when guilt prompts a scroll. It rarely sits in view while you decide whether to ride after work.
The habit gap between map and list
Exploration and accountability pull attention in different directions. Maps invite wide, slow looking. History invites point checks. Neither stays on your desk while you work.
Most training slips happen in the middle of the week, not because you lack data, but because the data is out of sight. You know Strava holds the answer. You still do not open it until Friday.
That is the bridge worth naming. Geographic tools shape where you might go. Temporal tools shape whether you go often enough. Without persistent visibility, both become Sunday-night review material.
Runners and cyclists share the pattern. A glowing river path on a map does not replace knowing that Wednesday was empty while your half marathon build expects four days of movement.
Put the numbers where your week happens
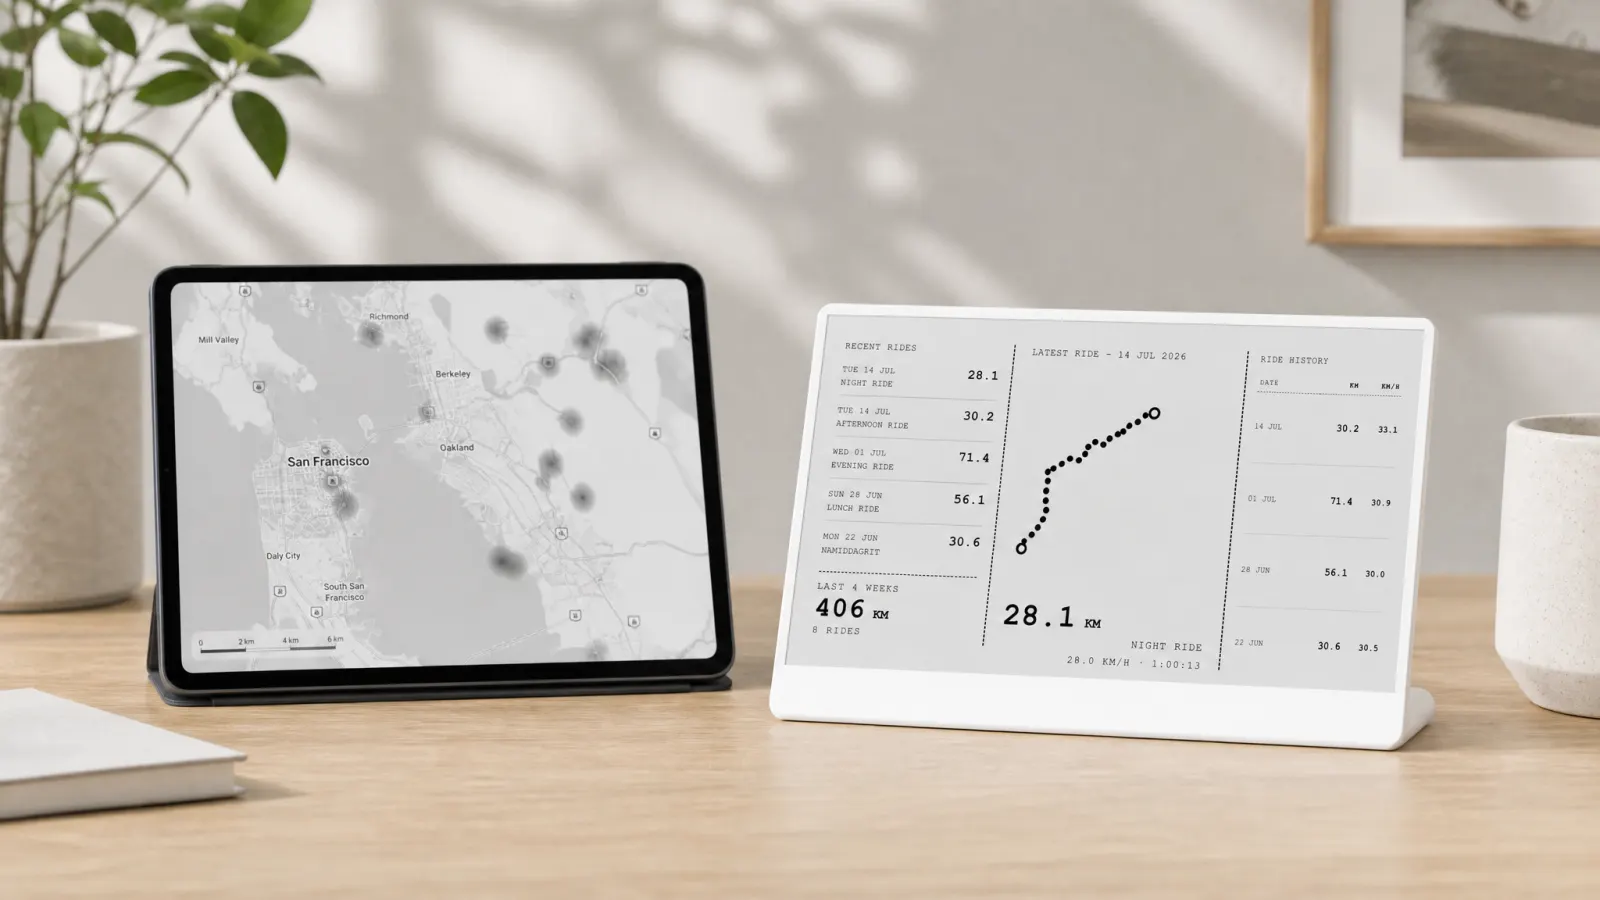
Activity Frame connects Strava to a TRMNL e-ink panel so key stats remain readable without unlocking a phone. You choose screens that mirror what ride history holds, but in a calm, always-on format.
Useful screens for closing the gap:
- Week grid turns ride history into a calendar you see at a glance
- Yearly goals shows kilometer progress toward your annual target
- Latest rides surfaces recent activities with route shapes and core stats
- Friends adds optional social context when peer movement helps
This is not a replacement for Strava analytics or a heat map for route planning. It is a display layer for athletes who already log activities and want fewer phone detours.
E-ink fits because the layout stays readable at a distance. You notice an empty Thursday square while passing the desk, not while opening another app.
If global route discovery matters to you, pair this habit with Strava Global Heatmap for planning sessions, then return to the week grid for execution.
A split workflow that actually sticks
Map day (monthly): scan your heat map, pick one new corridor, save it.
Execution days (weekly): let the week grid and yearly goals screen show whether you moved and whether you are on pace.
History day (post-ride): log details in Strava as usual. Latest rides on TRMNL catches the summary without another deep scroll.
Keeping roles separate reduces fake productivity. You are not training when you pan a map. You are training when a day box fills.
When phone checking is enough
If you already open Strava daily and never miss sessions, a desk display is optional. The product serves people whose consistency drops when stats stay locked away.
If you coach yourself with shame-based scrolling, add kindness to the system. Visible grids support neutral awareness better than roast-style jokes alone. Speaking of which, humor posts like Roast My Strava can be fun, but visibility beats viral screenshots for long-term habits.
Two tools, one visible habit
A strava heat map maps where you have been. Ride history lists what you did. Training needs both perspectives and a daily cue that does not require unlocking your phone.
Activity Frame bridges that cue. Connect Strava, pick screens like the week grid and yearly goals, and let TRMNL e-ink keep kilometers and consistency in peripheral view.
Create an Activity Frame account to connect Strava and choose the screens that match how you train.